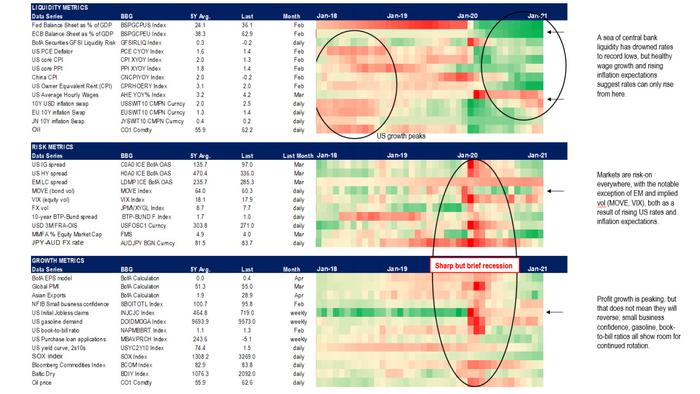
Global Heat Map Of Liquidity, Growth And Risk
While fundamental analysis has rarely mattered over the past decade in a centrally planned "market" dominated by central banks who reign by decree and jawboning, at the end of the day all investing boils down to just three axes: liquidity (how much money central banks are injecting or draining which is a function of interest rates and QE), risk (how sensitive traders are to bad news, and how much downside there is) and growth (corporate profits and macroeconomic upside). The rest is noise.
So to recap where we currently stand, Bank of America has published an extremely informative and handy heat map summary showing the current conditions across liquidity, risk and growth, which shows that while liquidity led growth and risk in the past 12 month, liquidity is starting to fade as a tailwind.
According to BofA, while a sea of liquidity drowned rates to record lows, "healthy wage growth and rising inflation expectations suggest rates can only rise from here." The good news is that both risk and growth remain solid drivers of upside: as BofA puts it, "markets are risk on everywhere, with the notable exception of EM and implied vol (MOVE, VIX) both as a result of rising US rates and inflation expectations." And while profit growth may be peaking..
.... it does not meant it will reverse according to BoA, which notes that small business confidence, gasoline, book-to-bill ratios all show room for continued rotation.
Tyler Durden Fri, 04/09/2021 - 13:20
http://dlvr.it/RxL47R

No comments:
Post a Comment