Thank This Mystery Put Seller For Today's Historic Market Reversal
Heading into today's rollercoaster session, we were - perhaps naively - confident that Friday's massive $3.1 trillion opex would also mark the bottom for stocks (an option expiration which we correctly said would be surrounded by massive volatility, as explained last Tuesday).
$3.1 TN opex tomorrow. Massive gamma expiration (with dealers deep negative). Stocks bottom
— zerohedge (@zerohedge) January 20, 2022
And - in a roundabout way - it did, because after plunging more than 4%, stocks staged a furious rally the likes of which have been seen only on a handful of occasions, before closing green. Putting today's historic reversal in context, this was only the sixth time since 1988 that the Nasdaq reversed a 4%+ intraday drop to close higher. The other days were 10/28/97, 10/26/00, 7/15/02, 10/10/08, and 11/13/08. As for the S&P, this was the biggest intraday comeback since November 2008 when the US was in the middle of the biggest financial crisis in recent history.
To be fair, while we did expect the market to bottom, we did not anticipate an early plunge as furious as the one that took place today (before it was replaced with an even more furious bounce). We did however expect the market to recover from the post op-ex "hangover", because as SpotGamma notes, the lows in the market during the December 2018 and March 2020 crashes both took place the day after options expirations.
And while this time it was a January opex, what was remarkable about this particular event, is that we had a record amount of puts selling heading into Friday's event, some of which expired, some of which did not.
We bring this up because as SpotGamma explains in its post-mortem, it was the previously discussed massive negative gamma expiration that was responsible for today's unprecedented volatility, but also it was a burst in option-linked activity that emerged around noon - just after the European close - that catalyzed the historic market reversal.
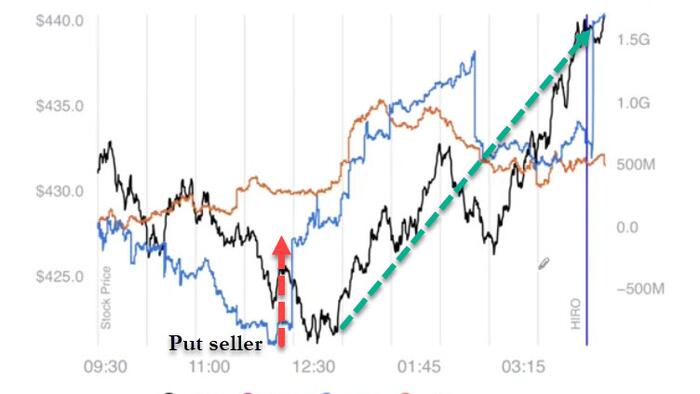
As shown in the chart below, which in addition to the S&P in black also shows put (blue) and call (orange) deltas, a massive put seller suddenly appeared (which via the negative gamma feedback loop also means dealers suddenly reverse from selling S&P futures to buying) just around noon, that was responsible for the slowdown in dealer selling and subsequent reversal, as a huge short squeeze kicked in and sent stocks sharply higher for the rest of the day.
Then from 12pm until roughly 3pm, the deltas in put options became increasingly positive dragging the market with them, as dealers scrambled to cover their long put hedges. At that point the reflexive pathway of put selling that also sent the VIX sharply lower (the VIX collapsed from 39 at the highs to 29 at the lows a few hours later driven in big part by this acceleration in put selling during the afternoon) had activated and prompted countless vol-targeting funds to join the buying frenzy.
Who was the put seller? Was it some contrarian dealer who had finally had enough of the waterfall selling, or was it some major hedge fund with little to lose, or perhaps it was the infamous plunge protection team? We don't know, but we do know the mechanism by which the reversal happened, and courtesy of SpotGamma you too can keep track of such major market inflation points as they explain in the video below.
Tyler Durden
Mon, 01/24/2022 - 19:31
http://dlvr.it/SHl2fM
No comments:
Post a Comment